Why Every Support Team Needs a Call Center Dashboard: Metrics That Matter
Anita
August 10, 2026
Why Every Support Team Needs a Call Center Dashboard (Metrics That Matter)
A support manager starts Monday morning with what looks like a good report.
Average handle time is down. The team answered more calls than last week. Most agents are within their targets. Nothing immediately suggests a problem.
Then the customer complaints arrive.
People are calling back about the same issues. One experienced call center agent is closing conversations quickly but leaving customers confused. Another agent spends longer on every customer interaction but consistently resolves the problem without a second call.
The numbers were technically correct.
They just weren't telling the whole story.
This is exactly why a modern call center dashboard matters.
A useful dashboard isn't simply a screen filled with charts and performance metrics. It connects operational data, agent performance, call quality, and customer satisfaction so managers can understand what is actually happening inside their support operation.
More importantly, it helps answer questions that totals and averages often can't:
Are customers actually getting their problems solved?
Which agents need coaching, and what specifically should they improve?
Is a drop in handle time improving efficiency—or hurting the customer experience?
Are quality problems isolated incidents or patterns affecting hundreds of customer calls?
For modern support teams, these questions are becoming more important than simply knowing how many calls were answered.
This guide explains which call center metrics deserve space on your dashboard, how evaluation and quality monitoring fit into the picture, and how support managers can turn performance data into better decisions.
Table of Contents
- What Is a Call Center Dashboard?
- Why Traditional Call Center Reporting Isn't Enough
- The Call Center Metrics That Actually Matter
- 1. Call Volume and Demand
- 2. First Call Resolution
- 3. Customer Satisfaction
- 4. Average Handle Time
- 5. Agent Performance
- 6. Call Quality and QA Evaluation
- 7. Repeat Contacts and Escalations
- 8. Customer Experience Signals
- Why Call Center Evaluation Belongs on the Dashboard
- What Should a Call Center Evaluation Form Measure?
- How to Connect Performance and Quality
- From Dashboard to Coaching
- Common Call Center Dashboard Mistakes
- How AI Is Changing Call Center Quality Monitoring
- Building a Dashboard Support Managers Will Actually Use
- FAQ
- Final Thoughts
What Is a Call Center Dashboard?
A call center dashboard is a centralized view of the operational, quality, customer, and agent performance metrics used to understand how a support operation is performing.
At its simplest, it might show:
- total call volume,
- average handle time,
- abandonment rate,
- first call resolution,
- customer satisfaction,
- agent availability,
- call quality scores,
- transfer or escalation rates.
But the best dashboards go further.
They connect these numbers.
That distinction matters because almost every key performance indicator in a call center can be misleading when viewed alone.
A lower average handle time might indicate better efficiency. Or it might mean agents are rushing customers.
Higher first call resolution rates might indicate better troubleshooting. But if customer satisfaction is falling at the same time, managers need to investigate what changed.
A high call center evaluation score may look encouraging until you discover that the score is based on only a tiny sample of calls.
A useful dashboard therefore doesn't just report the call center's performance. It gives managers enough context to understand why performance is changing.
Why Traditional Call Center Reporting Isn't Enough
For years, many support organizations focused heavily on operational efficiency.
How many calls came in?
How quickly were they answered?
How long did agents spend talking?
How many calls did each agent complete?
These metrics still matter. A contact center handling thousands of conversations cannot ignore staffing, queues, utilization, or high call volumes.
But operational numbers describe only one part of the customer service story.
Imagine two agents.
Agent A handles 60 calls during a shift.
Agent B handles 48.
If productivity is the only measurement, Agent A looks stronger.
Now add another layer.
Agent A has a 68% first call resolution rate. Agent B has 87%.
Then add customer feedback.
Customers consistently describe Agent B as clear, helpful, and knowledgeable.
Suddenly, "48 versus 60 calls" becomes a much less useful comparison.
This is why an effective call center dashboard needs multiple dimensions. Managers should be able to see the relationship between efficiency, quality, resolution, and the resulting customer experience.
The goal isn't to collect more data for the sake of it.
It's to understand what the data means.
The Call Center Metrics That Actually Matter
There is no universal list of metrics that works for every call center.
A technical support team may care deeply about repeat contacts and resolution. A billing team might prioritize accuracy and compliance. A retention team may need entirely different measures around save attempts and outcomes.
Still, several categories belong in almost every support dashboard.
The core call center dashboard metrics include:
- Call volume and demand
- First call resolution
- Customer satisfaction
- Average handle time
- Agent performance
- Call quality and QA evaluation
- Repeat contacts and escalations
- Customer experience signals
Together, these metrics create a more balanced picture of call center performance than efficiency metrics alone.
1. Call Volume and Demand
Start with the basics.
Managers need to understand how many customer calls are entering the operation and when those calls occur.
Useful measurements include:
- inbound call volume,
- calls by hour or day,
- answered versus abandoned calls,
- queue volume,
- peak periods,
- volume by reason or category.
Call volume provides context for almost everything else.
If call quality suddenly drops during a period when volume increased by 30%, that tells a different story than the same quality decline during a quiet week.
The same applies to agent productivity.
A call center agent working through an unusually heavy queue may behave differently from someone handling normal demand.
Modern dashboards should therefore make it easy to compare performance against workload rather than treating performance as something that exists in isolation.
2. First Call Resolution
First call resolution (FCR) measures whether the customer's problem was resolved during the initial interaction without requiring another contact for the same issue.
It is one of the most useful call center metrics because it sits directly between operational efficiency and customer experience.
When customers don't need to call again:
- total demand can decrease,
- queues become easier to manage,
- customers spend less time seeking help,
- agents handle fewer repetitive conversations,
- the overall customer experience can improve.
But first call resolution should never become a target agents try to "win."
A complicated problem may legitimately require follow-up.
Managers should look at the reasons behind the number.
For example, if one queue has consistently lower resolution than the rest of the call center, ask why.
Is information difficult to find?
Do agents lack permissions?
Is a particular product generating complicated issues?
Are transfers being counted incorrectly?
The dashboard tells you where to look. Investigation tells you what to change.
3. Customer Satisfaction
Operational metrics tell you what happened inside the support operation.
Customer satisfaction tells you something about how the customer experienced it.
CSAT is commonly collected after a customer service call through a short survey asking customers to rate their experience.
It's valuable, but it shouldn't stand alone.
Survey response rates vary. Extremely happy or frustrated customers may be more likely to respond. Some customers rate the company, product, pricing, or policy rather than the individual agent.
That's why call center managers should combine customer satisfaction with other signals such as:
- first call resolution,
- repeat contacts,
- sentiment,
- complaints,
- escalations,
- customer feedback,
- QA evaluation results.
Together, these signals provide a stronger view of performance and customer satisfaction than any individual score.
4. Average Handle Time
Few call center metrics are misunderstood as often as average handle time.
AHT usually includes talk time, hold time, and after-call work.
It's useful for workforce planning and understanding operational efficiency.
The problem begins when "lower" automatically becomes "better."
Imagine a customer calling because their internet connection has failed three times this week.
One agent gets them off the phone in four minutes.
Another spends nine minutes troubleshooting, explains the issue, checks the relevant account information, and prevents another call tomorrow.
Which interaction was more efficient?
The answer depends on what happened next.
An effective call is not necessarily a short call. It is a call that achieves the intended outcome without wasting the customer's or agent's time.
Use AHT as context—not as a definition of quality.
5. Agent Performance
A useful agent performance view shouldn't reduce people to a ranking.
Instead, it should help managers understand strengths, weaknesses, consistency, and coaching opportunities.
A dashboard might combine:
- calls handled,
- resolution rate,
- average handle time,
- transfer rate,
- QA score,
- CSAT,
- schedule adherence,
- repeat contact rate.
Looking at several measures together creates a much fairer framework to assess agent performance.
Consider a call center agent with excellent satisfaction scores but slightly longer calls.
Another agent might have outstanding efficiency metrics but low QA scores.
A third may perform well overall but struggle specifically with verification or escalation procedures.
Those agents don't need the same coaching.
Good performance management makes the differences visible.
The purpose of performance data shouldn't be to find the lowest score. It should be to find the next useful coaching conversation.
That shift can also boost agent morale. Evaluation feels very different when agents understand why they're being measured and how the information can help them improve.
6. Call Quality and QA Evaluation
Operational metrics can tell you that a conversation lasted eight minutes.
They cannot tell you whether those eight minutes were good.
That's where call quality enters the dashboard.
A typical call center evaluation examines whether the agent followed expected behaviors during the interaction.
Depending on the organization, the evaluation form might assess:
- greeting and opening,
- verification,
- active listening,
- communication clarity,
- empathy,
- troubleshooting,
- policy compliance,
- accuracy,
- resolution,
- closing.
A structured call evaluation form creates a consistent way to evaluate conversations across agents and teams.
For example:
Did the agent verify the customer's identity correctly?
Did they understand the reason for the call before proposing a solution?
Was the information accurate?
Did the agent explain the next steps clearly?
Was the issue resolved?
These questions provide information that handle time alone never could.
Call Scoring Needs Context
A call center evaluation form often assigns points or weights to different behaviors.
That can make comparisons easier, but call scoring should not become the entire QA strategy.
A score of 92% sounds precise.
But what caused the missing 8%?
Maybe the agent forgot a minor closing statement.
Or maybe they gave incorrect information that caused the customer to call back.
Numerically, both can reduce the score.
Operationally, they are very different problems.
A good QA evaluation should therefore preserve the reasons behind the score.
7. Repeat Contacts and Escalations
One of the clearest signs of friction is the customer who keeps coming back.
Repeat contacts can indicate:
- incomplete resolution,
- unclear instructions,
- product problems,
- missing agent permissions,
- inaccurate information,
- broken processes.
Escalations tell a similar story.
A high escalation rate isn't automatically an agent problem. Sometimes agents are correctly escalating situations they cannot resolve.
The useful question is:
Why are customers being escalated?
This is where dashboards become more valuable when metrics can be filtered by call reason, queue, team, product, or issue.
If hundreds of customers contact support repeatedly about the same problem, the solution may have nothing to do with agent training.
The process itself may need fixing.
8. Customer Experience Signals
Traditional dashboards were designed around what the call center could easily measure.
Modern dashboards increasingly need to reflect what customers actually experience.
That can include:
- sentiment,
- frustration,
- repeat contacts,
- unresolved issues,
- transfers,
- complaints,
- silence or excessive hold periods,
- escalation patterns.
Consider two interactions with identical resolution outcomes.
In one, the customer receives an answer immediately.
In the other, the customer is transferred three times before reaching the right person.
Both may technically count as "resolved."
They are not the same customer experience.
Understanding these differences helps managers improve customer journeys instead of optimizing individual numbers in isolation.
Why Call Center Evaluation Belongs on the Dashboard
Historically, quality monitoring often lived separately from operational reporting.
Managers looked at call statistics in one system.
QA teams performed call monitoring somewhere else.
Customer satisfaction lived in another report.
Coaching notes might be stored in yet another platform.
That separation makes patterns difficult to see.
A modern dashboard should bring operational performance and call center quality assurance closer together.
Suppose a manager notices that a team's first call resolution has declined.
Operational data identifies the problem.
Quality data can help explain it.
Maybe agents aren't asking enough diagnostic questions.
Maybe they are missing a required troubleshooting step.
Maybe a knowledge resource is outdated.
Maybe customers are calling about a newly emerging issue.
This connection between monitoring and evaluation is what turns a dashboard from a reporting tool into a management tool.
What Should a Call Center Evaluation Form Measure?
There is no perfect call center evaluation form.
The right criteria depend on what your agents actually need to accomplish.
Still, strong evaluation forms usually measure a combination of communication, process, accuracy, compliance, and outcome.
Opening and Verification
Did the center agent greet the customer appropriately?
Was required account verification completed?
Were security procedures followed?
Understanding the Issue
Did the agent actively listen?
Did they ask relevant questions?
Did they correctly identify the customer's reason for contacting support?
This part of the agent evaluation is particularly important because a technically correct answer to the wrong problem is still a bad support experience.
Communication
Was the agent clear?
Did they avoid unnecessary jargon?
Did they set realistic customer expectations?
Did they show appropriate empathy?
Problem Solving
Did the agent follow the correct process?
Was the information accurate?
Did they use available resources effectively?
Could they have resolved the issue without escalation?
Compliance
A call center compliance section may cover required disclosures, authentication, privacy procedures, or industry-specific requirements.
These items may deserve higher weighting because the consequences of failure are different from forgetting a preferred phrase.
Resolution and Closing
Was the customer's problem resolved?
Were next steps explained?
Did the agent confirm that the customer understood what would happen next?
A strong agent evaluation form should ultimately help answer a simple question:
Was this a good customer interaction?
If an evaluation form cannot help managers answer that, it may contain too many criteria that are easy to score but not meaningful to customers.
How to Connect Performance and Quality
The most useful dashboard doesn't force managers to choose between operational metrics and call center quality.
It shows how they influence each other.
AHT ↓ + FCR ↓ + Repeat Contacts ↑
Agents may be moving through calls faster but failing to fully resolve issues.
AHT ↑ + FCR ↑ + CSAT ↑
Longer conversations may be producing better outcomes.
QA ↓ + CSAT Stable
Internal process or compliance standards may be slipping even though customers haven't noticed yet.
QA ↑ + CSAT ↓
Agents may be following the evaluation form perfectly while customers remain unhappy—possibly because the form measures the wrong behaviors.
This is why identifying key performance relationships matters more than obsessing over individual targets.
A dashboard should encourage managers to ask why? before they ask who?
From Dashboard to Coaching
The best dashboard eventually disappears into a conversation.
A supervisor notices a pattern, opens the supporting interaction, understands what happened, and talks to the agent about it.
That's the real value.
Imagine a contact center agent's performance dashboard showing declining first call resolution.
A weak management response would be:
"Your FCR is below target. Improve it."
A useful response sounds more like:
"I noticed several billing calls where customers contacted us again within a few days. Let's review two of those conversations and see what's happening."
Now the metric has become evidence.
The evaluation experience becomes specific rather than abstract.
Managers can evaluate agent performance using actual interactions, identify repeat behaviors, and build coaching around something the agent can change.
This is also where evaluation and feedback should connect.
An effective evaluation system doesn't end when the score is calculated.
It creates a loop:
Interaction → Evaluation → Insight → Coaching → Improvement → Measurement
That loop is essential for effective performance management.
Common Call Center Dashboard Mistakes
Adding more charts doesn't automatically create better visibility.
In fact, one of the most common dashboard problems is simply too much information.
Treating Every Metric Equally
Twenty-five KPI cards across the top of a screen don't tell managers what needs attention.
A better approach is to create hierarchy.
Which metrics describe demand?
Which describe outcomes?
Which describe quality?
Which require action?
Ranking Agents Without Context
A leaderboard may show who handled the most calls.
It doesn't necessarily show who delivered the best support.
If rankings are used, managers should consider workload, call type, tenure, complexity, QA results, and other factors affecting the performance of agents.
Using Averages for Everything
Averages hide extremes.
An average QA score of 88% could mean every agent performs around 88%.
Or half the team scores 98% while the other half scores 78%.
Those situations require completely different management responses.
Measuring Quality From Too Few Calls
Traditional call quality monitoring frequently relies on a small sample.
A supervisor might manually evaluate five interactions from an agent who handled 500 calls.
Those five conversations represent just 1% of their work.
This creates obvious limitations.
Was the sample representative?
Were unusual calls selected?
Did the evaluator happen to choose particularly good or bad conversations?
The smaller the sample, the more carefully managers should interpret the result.
Building the Dashboard Around Punishment
If agents associate dashboards exclusively with being watched, scored, or ranked, they will naturally resist them.
Instead, use performance visibility to help agents understand expectations and identify opportunities to improve performance.
The dashboard should support a better agent, not simply a better spreadsheet.
How AI Is Changing Call Center Quality Monitoring
This is one of the biggest changes happening in modern support operations.
Traditional call center quality monitoring depended heavily on supervisors manually selecting and reviewing interactions.
That made detailed evaluation expensive and slow.
AI can change the scale.
Instead of reviewing only a small sample, automated systems can analyze much larger volumes of conversations and identify behaviors or patterns across the call center.
Depending on the technology and available data, analysis may include:
- whether required steps occurred,
- common call reasons,
- resolution signals,
- escalation patterns,
- customer sentiment,
- repeated complaints,
- communication behaviors,
- compliance indicators.
This doesn't mean human judgment disappears.
Quite the opposite.
Managers still need to interpret context, review unusual cases, coach agents, and decide what actions make sense.
But automated analysis can help answer a different question.
Instead of:
"What happened in the five calls I reviewed?"
Managers can increasingly ask:
"What patterns are appearing across thousands of calls?"
That's a fundamental change in quality management.
It can also make call center agent evaluation more representative because decisions aren't based exclusively on a handful of manually selected interactions.
AI-assisted quality monitoring can surface patterns. Human managers still determine what those patterns mean and what should happen next.
Building a Dashboard Support Managers Will Actually Use
A dashboard succeeds when it helps someone make a decision.
Before adding another metric, ask:
What would a manager do differently after seeing this number?
If there is no clear answer, the metric probably doesn't deserve prominent dashboard space.
A practical dashboard can be organized into four layers.
Layer 1: What's Happening?
Show demand and operational health.
Call volume. Queue activity. Abandonment. Service levels.
Layer 2: Are Customers Getting Results?
Show outcomes.
First call resolution. Repeat contacts. Escalations. Customer satisfaction.
Layer 3: How Well Are Agents Handling Interactions?
Show center agent performance and quality.
QA results. Communication behaviors. Compliance. Resolution effectiveness.
Layer 4: Why Is Performance Changing?
Show drivers.
Call reasons. Emerging issues. Agent-level patterns. Customer complaints. Process failures.
This hierarchy creates a clear framework to assess agent performance without turning the dashboard into a wall of unrelated numbers.
The Dashboard Should Answer Questions, Not Just Display Metrics
The difference between an average dashboard and a useful one often comes down to how quickly it answers real management questions.
A support manager should be able to ask:
Why did customer satisfaction fall this week?
Which call reasons have the lowest first call resolution?
Which agents are struggling with the same evaluation criteria?
Are long handle times associated with particular customer issues?
Which queues generate the most repeat contacts?
What behaviors separate high-performing agents from the rest of the team?
Are customers contacting us about something new?
Is a quality problem isolated to one call center agent or affecting the whole team?
When a dashboard makes these questions easy to investigate, it becomes part of everyday call center operations rather than another report managers check once a month.
Don't Forget the Story Behind the Metric
Return to that Monday morning dashboard.
Average handle time was down.
Initially, that looked like progress.
But after combining operational data with call quality, repeat contact rates, and evaluation results, the manager discovers something else.
Several agents were shortening conversations by skipping important troubleshooting questions.
Calls became shorter.
Resolution became worse.
Customers called again.
The original metric wasn't wrong.
The interpretation was.
This is perhaps the most important principle when evaluating call center performance:
A metric tells you what changed. Context tells you whether that change was good.
That's why the strongest dashboards don't optimize one number.
They connect the performance of the call center agent, the outcome of the interaction, and the experience of the customer.
Frequently Asked Questions
What is a call center dashboard?
A call center dashboard is a centralized view of metrics that help managers monitor operational performance, agent performance, call quality, customer satisfaction, and customer outcomes. It typically combines metrics such as call volume, average handle time, first call resolution, QA scores, repeat contacts, and CSAT.
What are the most important call center dashboard metrics?
The most important metrics usually include call volume, first call resolution, customer satisfaction, average handle time, abandonment rate, repeat contact rate, escalation rate, agent performance, and call quality scores. The exact key performance indicators should reflect the goals of the support team.
How do you evaluate call center agent performance?
To evaluate agent performance fairly, managers should combine operational metrics with quality and customer outcomes. Useful measures include resolution rates, QA evaluation results, customer satisfaction, repeat contacts, transfer rates, average handle time, compliance, and communication quality.
What is a call center evaluation form?
A call center evaluation form is a structured scorecard used to assess the quality of a customer interaction. It may measure verification, active listening, communication, accuracy, troubleshooting, compliance, resolution, and closing behaviors.
What is call center quality monitoring?
Call center quality monitoring is the process of reviewing customer interactions to determine whether agents meet defined quality, compliance, communication, and service standards. Monitoring may involve manual call reviews, call recordings, automated conversation analysis, or a combination of these methods.
How does a dashboard improve agent performance?
A dashboard can improve agent performance by making patterns visible. Instead of giving agents generic feedback, managers can identify specific behaviors associated with lower resolution, poor call quality, repeat contacts, or customer dissatisfaction and use those insights for targeted coaching.
Why shouldn't call centers focus only on average handle time?
Average handle time measures efficiency but does not show whether the customer's issue was resolved. A short call followed by another call about the same problem may ultimately create more work than a slightly longer conversation that resolves the issue the first time.
How can AI improve call center evaluation?
AI can help analyze larger volumes of customer conversations than traditional manual sampling. It can surface recurring call reasons, quality behaviors, sentiment, compliance signals, escalation patterns, and potential coaching opportunities. Human oversight remains important for interpreting context and making management decisions.
Final Thoughts
An effective call center dashboard is not a scoreboard.
It's a decision-making system.
Support managers need visibility into demand, efficiency, resolution, agent performance, call quality, and customer satisfaction at the same time. Operational performance metrics explain how the center is running, while call center evaluation and quality monitoring help explain how customers are actually being treated.
The most useful dashboards also connect those layers.
They show when shorter calls create more repeat contacts. They reveal when a high QA score isn't translating into a better customer experience. They help managers understand whether poor results come from individual coaching needs, broken processes, emerging customer issues, or unrealistic expectations.
Most importantly, they turn measurement into action.
Because the goal of call center quality assurance isn't to produce more scores.
The goal is to improve agent performance, strengthen service quality, and make every customer interaction more likely to end with the right outcome.
A dashboard should make that story easier to see.
Share on social media


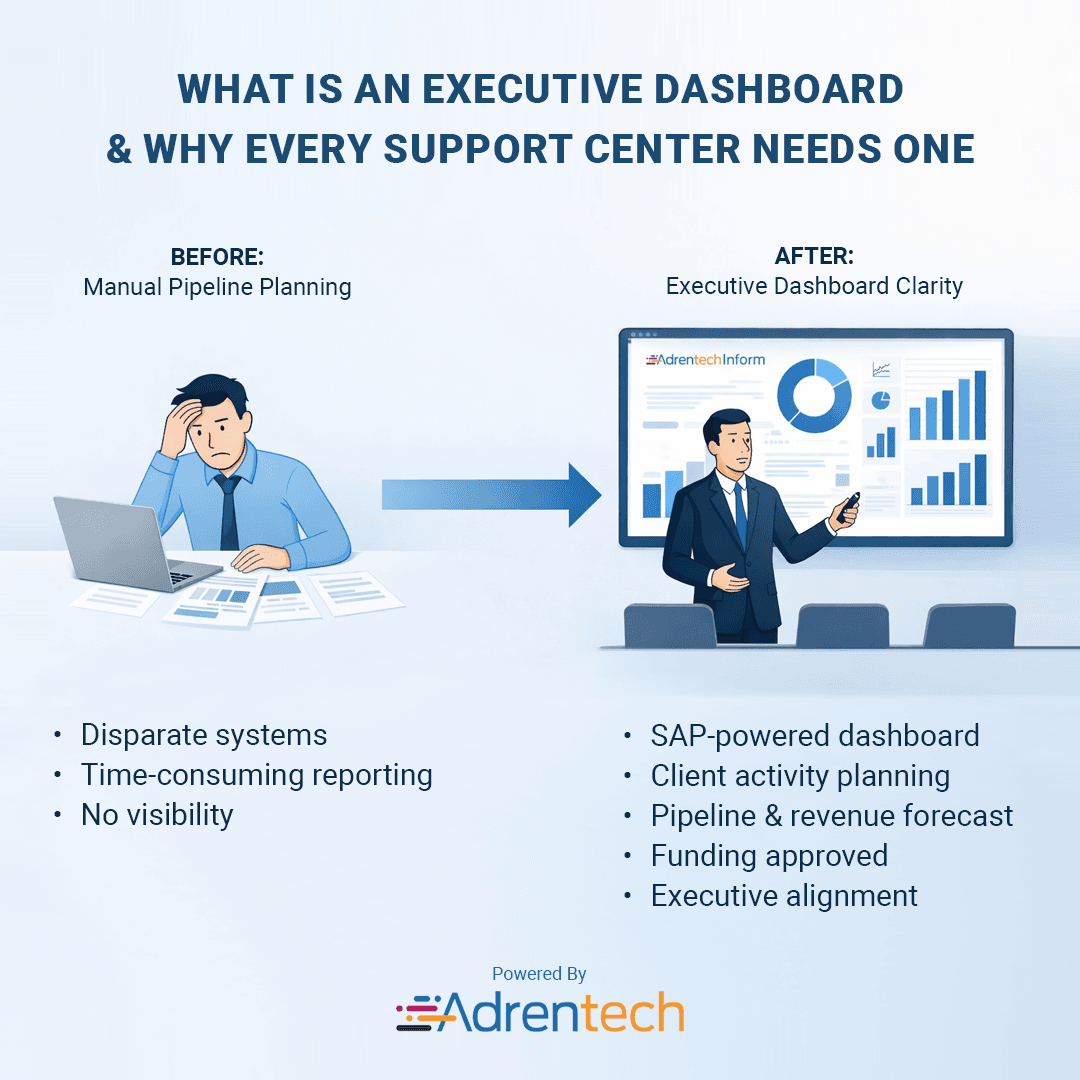
What Is an Executive Dashboard & Why Every Support Center Needs One